.png)
Case Study
Recurring UAS (Drone) Aggregates Surveys
With help from our partner:
Barriere Construction
Accurate pile inventories delivered quickly.

Overview:
In 2015, the U.S. produced about $8.3 billion in sales from industrial sand and gravel.¹ Shrinking material production in the Gulf Region, caused by new zoning and land development regulation, has struggled to keep pace with high demand created by new construction projects. These factors have increased the pressure on yard managers to know exactly how much material they have at any given time.
Regular surveys of stockpile yards by unmanned aerial systems (“UAS”, commonly known as “drones”) and accurate volumetric analysis of that survey data, is invaluable for keeping close tabs on aggregates inventories and deriving actionable insights to improve inventory management.
Several years ago, aggregates facilities were conducting ground-based surveys that could take days for a crew to execute on foot, and a week to process the data and derive insights. Today, with the proliferation of drone technology, these same surveys can be conducted in minutes, and the data processed in hours.
This case study focuses on the application of drones and photogrammetry techniques on a semi-regular basis to provide updated material inventories that become better and more accurate over time.
Economic Significance:
Material shortages, combined with the immediacy and competitive nature of the job bidding process in the construction industry, require decision-makers to have current and accurate information about their inventory quantities in order to make informed decisions about capabilities and pricing strategies.
In 2017, the average price of sand and gravel in the US was $9.59 / US ton.¹ For a relatively small pile weighing 6,000 tons, an inventory error of just ± 5% is worth ± $3,000. Multiplied across 20 or 30 piles at a stockpile yard, with material movement at various rates over any given time period, that ± 5% surprise gain or loss can easily turn into a significant operational and accounting nightmare.

Figure 1: Construction Sand and Gravel Price Per Short Ton - Missouri Dept. of Natural Resources
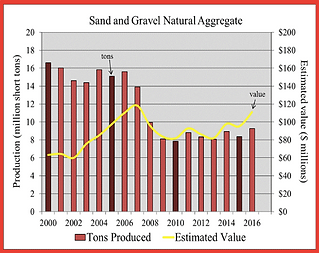
Figure 2: Sand and Gravel Natural Aggregate - Virginia Division of Geology and Mineral Resources
Context
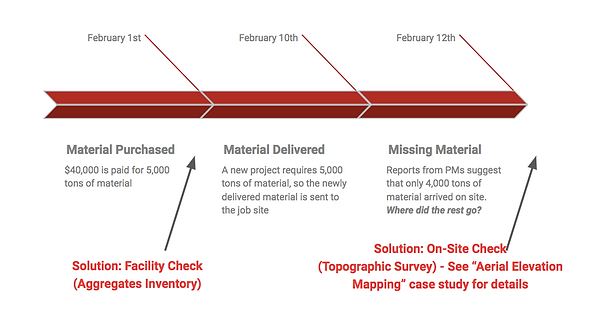
A company in the heavy civil and aggregates business oversees the sale of over 100,000 tons of material month to month. Purchasing and fulfillment orders of $1,000,000 or more are commonplace. Given the scale of the operation, misplaced material can cost the business thousands of dollars. Worse yet, material manufacturers could be under-delivering material, or accidentally double-invoicing.
Our Mission
Our Mission
Faced with increasing demand for accurate and timely material quantities, a Client decided to explore how a UAS inventory management solution might help their operation. The Client needs to accurately double check their delivery quantities, analyze their capacity to sell material and take on additional projects, and provide a third-party audit for tax-purposes.
After sitting down with the Client, we decided that a successful project would meet the following three criteria:
-
Increase Client’s confidence in operational accounting
-
Survey and analysis turnaround time under 3 days
-
3D volumetric analysis error under 3%
The Process
1. An FAA certified unmanned aircraft pilot, accompanied by a trained field engineer, pre-program and fly a grid survey mission to collect high-definition 2-dimensional RGB data covering the entire facility and a series of survey-grade ground control points.
2. Back at HQ, this 2-dimensional RGB data is pre-processed by our analysts using a powerful computer and photogrammetry program. The result: a 3-dimensional point cloud that can comprise over 100 million individual points.
3. Non-terrain structures within the point cloud (i.e. plant vehicles, construction equipment, radial stackers, bridges, etc) are removed to produce a clean digital terrain model (DTM) that reflects elevations across the facility on the survey date.


4. Next, pile perimeters drawn by analysts and checked by a dedicated project manager are created around existing piles of material based on a markup map provided by yard managers.
5. With the help of powerful GIS and CAD systems, pile volumes are estimated using a triangulated base surface.
6. After completing multiple surveys at the facility, enough base elevation points have been collected at the toes of piles to build a custom base surface. This base surface takes into account nuanced changes in elevations underneath existing piles of material, providing more accurate material estimates over time.*
7. Depending on facility management, significant weather events, and other geographical characteristics of the site, recommendations to changes in the custom-built base surface may be made that address location-specific changes over time.
Solution
Data Acquisition Method:
-
Recurring high-definition planar photogrammetry survey via unmanned aerial system (UAS)
-
Centimeter-precise and globally-accurate GPS ground control points collected via real time kinematic (RTK) across a clients facility
Execution Time Frame:
-
½ day: aerial data collection and ground control survey data collection
-
1 day: digital 3D model build, quality control, volumetric analysis
-
1 day: draft review with yard manager, 2nd round of quality control checks, final delivery to management and accounting
-
Total turnaround time for single survey: 2½ days
Accuracy:
-
Horizontal Variance (X,Y Error): under 1 inch (in checkpoint cases, about ⅓ inch)
-
Vertical Variance (Z Error): under 1.25 inches (in checkpoint cases, about ⅓ inch)
-
3D volumetric analysis error: <3%
Results
Download the Case Study PDF:
Two days after the deployment of a Tenbo Air field crew, the client receives volume measurements for each pile at the facility. Pile measurements include material codes/names, density factors, converted and calculated tonnages, and analyst documentation of any strange or unusual pile phenomena.
The volumetric measurements also come packaged alongside a high-resolution aerial map (orthomosaic tiff) and a 3D model (PDF and hosted online) with annotations - perfect for sharing with the boss, board, and other stakeholders.
Point cloud data (.las, .laz, .ply, or .xyz), CAD files (.fbx, .dxf, .obj), and a DSM or DTM can also be provided.*
